If your current Wi-Fi setup isn’t providing a reliable experience throughout your intended coverage area, you might want to consider re-evaluating your setup and taking the necessary steps to optimize it.
There are several ways to improve Wi-Fi performance; a few of the most common methods include moving your Wi-Fi router to a central location, ensuring the least path of obstruction between your router and client devices, enhancing the Wi-Fi range using Range Extenders, or even upgrading to an advanced Mesh or Access Point based Wi-Fi system.
Apart from these, you also need to ensure that you tune your wireless settings to avoid channel interference, and place Wi-Fi nodes at the right positions to ensure optimal coverage and distribution of signal throughout your home or office.
Wi-Fi Analyzers are client-side software applications that analyze your wireless network to identify potential problems. It can also help you select the best possible location for placing your wireless router, or picking the right wireless channels, to minimize interference with other Wi-Fi networks operating in the vicinity.
In this article, we’ll explore a popular Wi-Fi Analyzer app for Windows and macOS, called NetSpot Pro.
Improve your home, office Wi-Fi experience with NetSpot App
NetSpot is a professional Wi-Fi Analyzer app for troubleshooting Wi-Fi coverage and signal quality issues.
The free version of the app lets you scan available networks in your area, and provides real-time information on wireless signal strength, operating band & channel, security scheme, etc., for all nearby Wi-Fi networks. It’s the perfect free tool for home users who want to troubleshoot the Wi-Fi performance of their current wireless setup.
For advanced users, NetSpot Pro comes with a Survey mode, which can be used to conduct detailed wireless site surveys for homes or office spaces. The feature lets you scan the Wi-Fi signals throughout different positions within the survey area and then generates heatmaps based on several indicators, such as Signal Quality, Signal-to-Noise ratio, Signal-to-Interference ratio, etc.
By analyzing the different heatmaps, you can detect potential causes for network performance issues, like weak router performance, rapid drops in signal due to physical obstructions, presence of weak spots or dead zones in Wi-Fi coverage, etc.
When upgrading the Wi-Fi setup for large, multi-floor apartments, office spaces, or old establishments (where Wi-Fi signals usually have weaker penetration through walls), Wi-Fi site surveys provide valuable insights into the planning and deployment, ensuring optimal performance, cost, and resource utilization.
You can download the free version of NetSpot for Windows and macOS, directly from the official website, and then upgrade to the Pro edition via the purchase links available in the app. The Home and Pro versions of the app are also available on the Mac App Store.
NetSpot is even available on both Android and iOS. But, the mobile versions don’t include the survey feature. Also, the iOS version of NetSpot requires a hardware-based network analyzer from Oscium, called WiPry 2500x.
Features of NetSpot app
NetSpot Wi-Fi Analyzer app offers two key ways to scan and analyze the available Wi-Fi networks in and around your neighborhood.
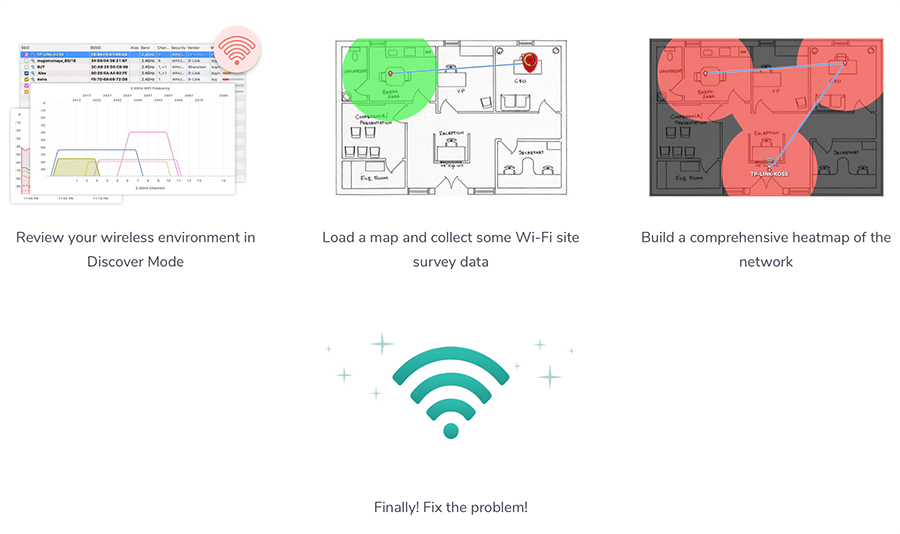
NetSpot Discover Mode (Free)
With the “Discover” mode, NetSpot can help identify potential issues with your wireless setup. It automatically scans your location for nearby Wi-Fi hotspots and lists their details. Based on the preliminary analysis of the Discovery Mode, you can fine-tune your own network settings to potentially improve wireless performance.
Here’s how to use the “Discover” mode on NetSpot.
- Launch the NetSpot app on your Mac or Windows PC.
- Click on the Discover tab and wait for some time. The app will automatically scan and list the available wireless networks in your area.
- The list contains information such as SSID, BSSID (Mac Address), operating band, channel, and mode (a/b/g/n/ac/ax), security protocol, the vendor of the access point device, Signal-to-Noise (SNR) Levels, Signal level & percentage, Noise level & percentage, Signal average, minimum, and maximum, Noise average, minimum, and maximum.
- Double click on particular Wi-Fi networks to provide graphical interpretations of signal and noise levels, strength, and operating channels of each detected Wi-Fi network in the 2.4 GHz and 5GHz bands.
These details can help you troubleshoot potential problems you might be facing with your current network. For example, there may be multiple wireless networks sharing the same Wi-Fi channels as yours, and you might improve your network performance simply by changing the operating channel on both 2.4 GHz and 5 GHz bands.
Experiencing lower signal levels in your study, office, or living room? Maybe changing your router’s position can help. Is signal strength quickly dropping across different rooms? You might need a range extender to increase the range of your wireless network, or even upgrade your wireless network entirely.
NetSpot Survey Mode (Premium)
By performing a Wi-Fi Site Survey, you can visualize the coverage of your wireless router throughout your residence or organization, identify weak spots, and design your wireless network. It’s a handy tool for network planning, especially if you need to deploy Wi-Fi in older buildings, office spaces, or a generally large area with a multi-floor layout.
With NetSpot Survey mode, you can upload a floor plan of your building, designate zones, and then scan nearby Wi-Fi signals, and generate different heatmaps of wireless signals throughout your floor plan. Heatmaps are color-coded to indicate different levels of signal intensity at different positions. By default, the scale goes from red to blue based on the minimum and maximum range provided by the user, with red signifying the strongest signal and blue signifying the weakest.
To perform a site survey using NetSpot, follow the steps below. You need a Home, Pro, or Enterprise license to access these features.
- Launch NetSpot Pro on your Mac or Windows PC.
- Click on the Survey tab and then click on “Start a new survey”.
- Follow the instructions on the screen to start the Wi-Fi site survey. You need to give your project a name, and then assign a zone.
- You need a floor plan of your building for the survey. The map should designate obstructions, such as walls, along with labels for different rooms. You can upload an image of your floor plan here. If you’re surveying for a multi-floor building, you can upload the map of different floors in separate zones. You can even draw your own map directly in the app, or use one of the pre-defined samples. After selecting the appropriate option, click Continue to proceed.
- In the next step, you need to specify two points on the map and specify the actual distance between them. Click Continue when you’re done.
- Next, you need to select the networks that you want to include in your survey. NetSpot automatically surveys open Wi-Fi networks, but here, you can also include a non-broadcasting network. Each network you include would increase the scanning time. Click on Continue once all your preferred networks are selected.
- NetSpot runs passive wireless scans by default. You can optionally enable Active Scanning for specific networks to measure upload and download speeds. You’d need to be able to connect to these specific Wi-Fi networks to perform Active Scanning. Click Continue again to proceed.
- On the next screen, you’ll start the survey. Click on a point on the map you uploaded (or drew) to designate your current location. Wait for a few seconds for NetSpot to perform the scan. You’ve now created your first data point.
- Move to the next nearby spot inside the building and drop another pin on the map to create the second data point. NetSpot will scan wireless networks at this position as well.
- Repeat Step #9 until you’ve covered most of the survey area. When you’re satisfied with the survey, click the Stop Scan button.
NetSpot will take some time to consolidate the survey results. Once done, it’ll generate different types of heatmaps, including Signal Level, Signal-to-Noise Ratio, and Signal-to-Interference Ratio, superimposed on top of your drawn or uploaded floor plan.
From here, you can customize the survey report, set the minimum and maximum signal range, and view different characteristics of the available wireless networks throughout the scanned area. The heatmap helps you visualize the behavior of surrounding wireless networks, signal levels, noise levels, operating frequency bands, and more. You can filter the heatmap to include or exclude specific networks, or even export the survey results to a file.
By analyzing the heatmaps, you can identify potential problems in your Wi-Fi setup, rectify them, and re-run a scan to ensure that the wireless performance has improved.
The thing about NetSpot is, you don’t need to be a pro to perform these surveys. The NetSpot Survey wizard walks you through each step. But even if you are a professional network engineer, NetSpot’s Site Survey tools can help you plan and design large-scale wireless networks.
If you want to learn more about the networking terms used by NetSpot in their app, refer to the terms & definitions guide available on their website.
NetSpot Versions and Pricing
NetSpot offers a free version without the Survey feature, along with 3 different paid versions, called Home, Pro, and Enterprise. You can learn more about the features and pricing for the different available versions from the official website. All of the paid NetSpot versions are one-time purchase licenses and come with a Lifetime Upgrades Warranty.
For the features that NetSpot provides, it offers an affordable price that beats most of the competition. If you’re looking to improve your Wi-Fi setup, Wi-Fi Analyzers and Site Survey tools like NetSpot Pro are highly recommended.